The landscape is rapidly evolving with respect to how colleges and universities use data, analytics, and social media to find, engage, and convert their prospective students. In the early days of social media, building an online following was “free.” Now, with seemingly interminable updates to algorithms on social networks, the rise in adoption of private messaging apps, and increasing ways to “pay for eyeballs” on the web; building and engaging with a following comes with a significant investment of resources. This means that using the right channels and attributing tangible enrollment outcomes to digital marketing and social media has become a necessity.
However, it’s even more important to understand your target audience’s use and view of these digital platforms to make sure you’re investing in the right areas before launching your recruitment approach. Today’s student sentiment toward social media platforms, in particular, will transform your admissions marketing strategy. Only a year ago, our findings from the 2017 Social Admissions Report revealed that 60% of students liked or followed a school on their consideration set and nearly 40% of students indicated that conversations they have on social media influence their decisions of where to enroll.
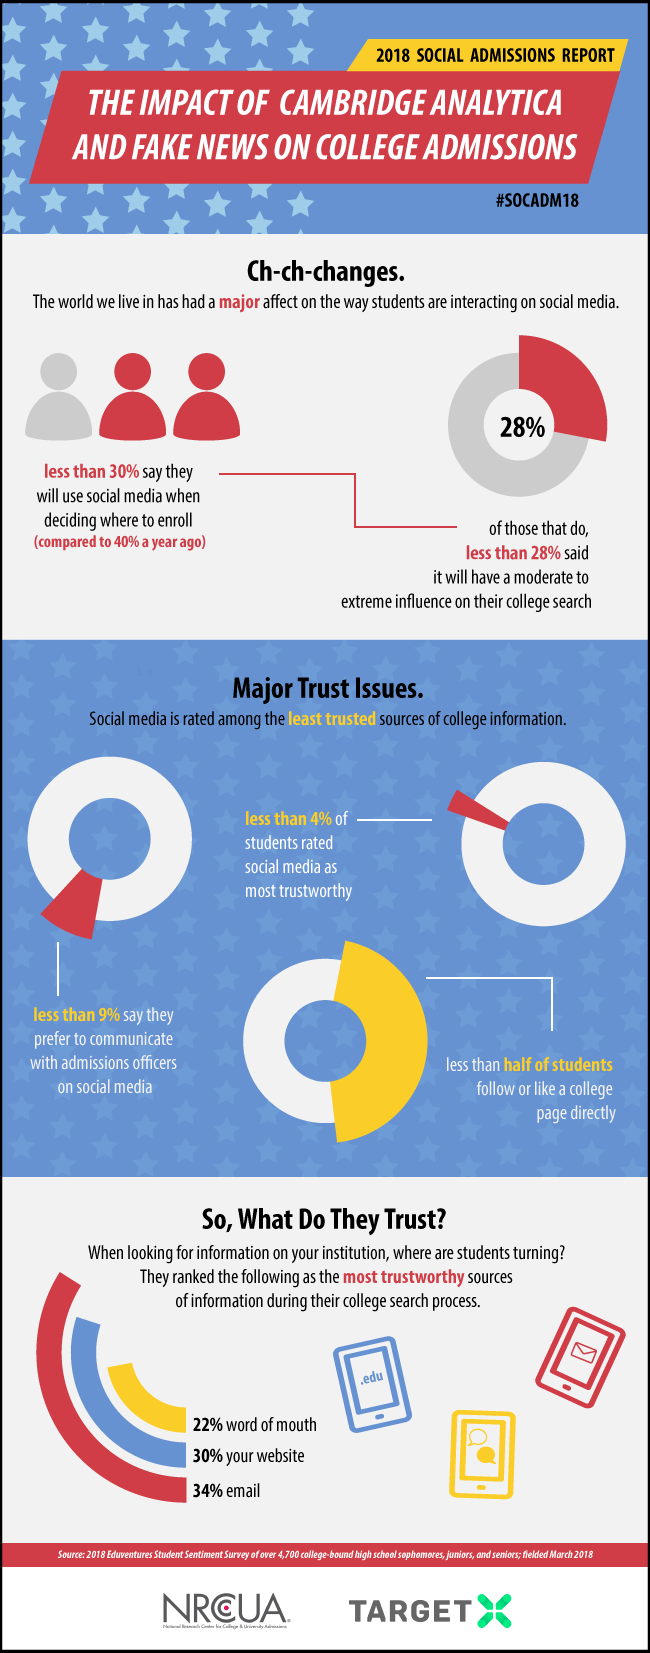
Now, with all of the “fake news” crowding the media, the current political climate, and events like the Cambridge Analytica fallout, we’ve found that students are developing a general distrust for social media outlets. In fact, social media is rated among the least trusted sources of information according to our survey results for this year’s Social Admissions Report. If students are becoming skeptical of information shared via social channels, institutions need to respond by fine-tuning their digital admissions marketing tactics.
Check out the infographic below to uncover some surprising statistics from the 2018 Social Admissions Report. To avoid being seen as “fake news” and to better inform your digital marketing strategy, watch our webinar recording on more of the findings from this year’s report!
{{cta(‘7cd45f15-9ad9-48ff-be93-4c0c93d96169’)}}
Check out the webinar recording to learn more and reveal the findings of the 2018 Social Admissions Report!
{{cta(‘7cd45f15-9ad9-48ff-be93-4c0c93d96169’)}}